Structural Optimization of L-Bracket (FEA)
Project Overview & Methodology
This project investigates two variants of a stainless-steel L-bracket—a solid model and a rib-reinforced model—using ANSYS Static Structural.
Both brackets were fixed at their back faces and subjected to a 500 N vertical load on the free arm.
We performed a mesh independence study to ensure numerical accuracy, then evaluated total displacement and von Mises stress distributions
to assess how ribbing influences stiffness and stress concentration.
Material properties were defined for AISI 304 stainless steel (E = 200 GPa, ν = 0.3) under the small‐strain, linear-elastic assumption.
By comparing the peak deflection and maximum equivalent stress between the plain and ribbed designs,
we quantified the mechanical benefit of the ribs and established data-driven guidance for lightweight bracket optimization.
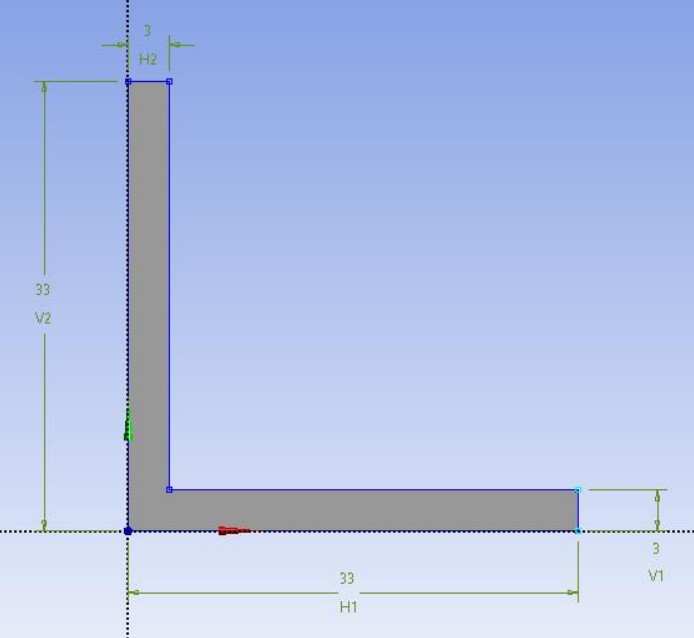
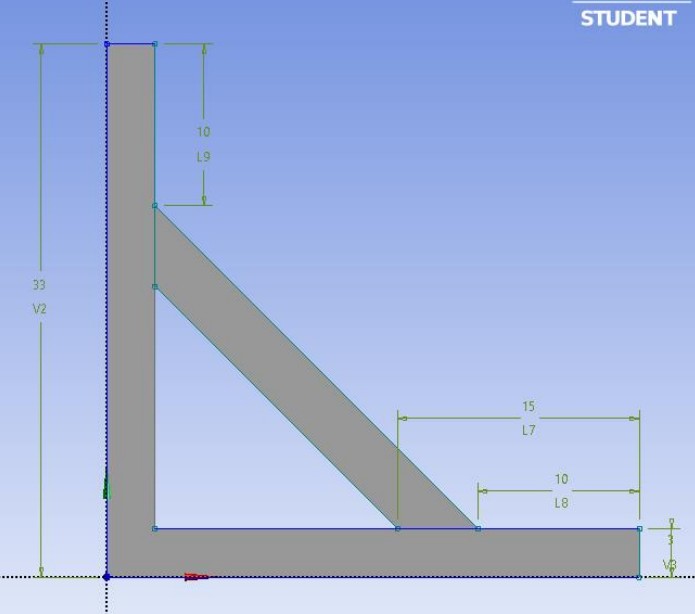
Dimensional CAD Drawing
Mesh Convergence Study
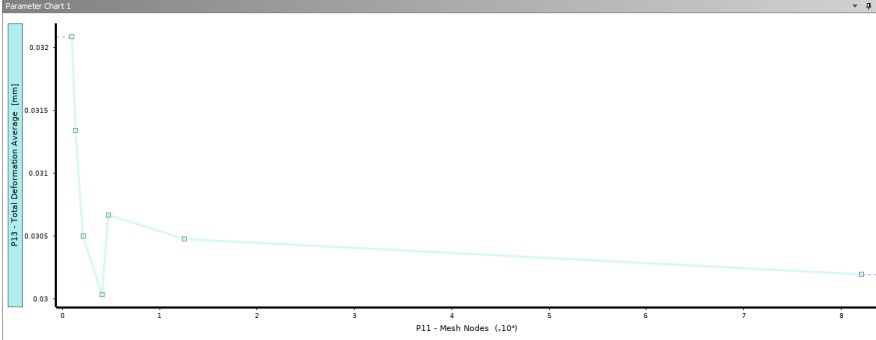
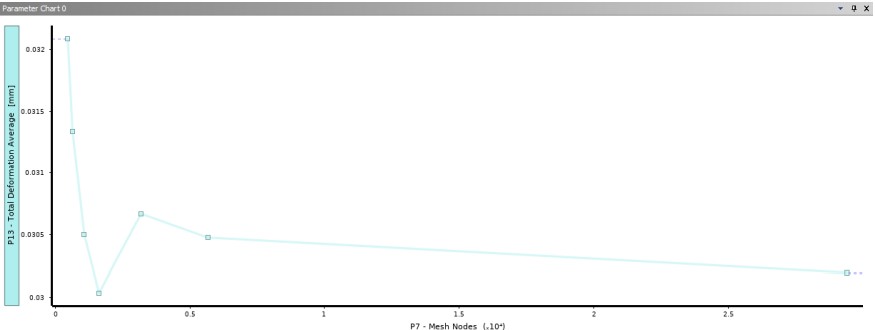
Mesh-independence was verified by refining until deformation results stabilized.
Both brackets show converging trends, indicating mesh-independent accuracy.
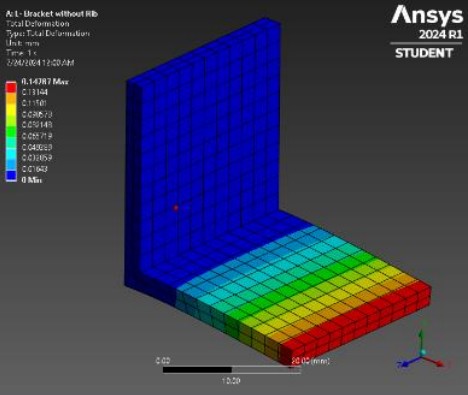
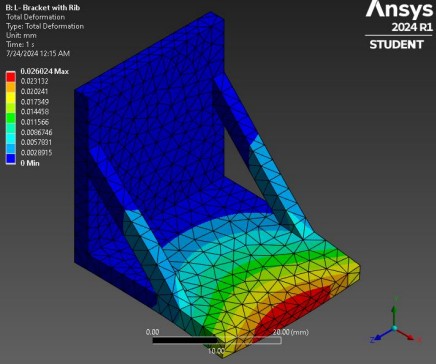
Total Deformation Analysis
Maximum deflection occurred along the free edge. The plain bracket deformed 0.14384 mm versus
0.02602 mm for the ribbed bracket—an 81.9% reduction.
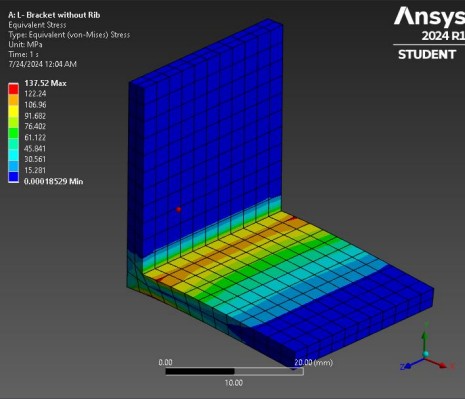
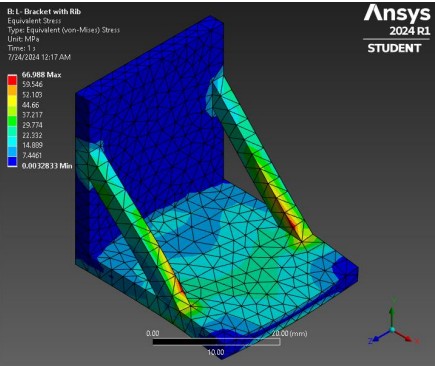
Equivalent Stress Analysis
Peak stress at the 90° bend was 137.52 MPa for the plain bracket and 66.99 MPa for the ribbed version—a 51.3% drop.
Discussing Analysis
Mesh
By utilizing mesh in ANSYS, precise calculations can be performed on smaller
sections of larger designs. Running a mesh convergence analysis allows us to
observe deformation across the mesh. For Project 1, I used the default
meshes for each bracket. The convergence study shows both trends stabilize,
with a minor breakout point, confirming mesh-independent results.
Total Deformation
Total deformation analysis reveals the effects of forces acting on an object. In
Project 1, both brackets experienced greatest deformation away from the fixed
end, specifically along the free edge. The ribbed bracket’s supports significantly
reduced overall deflection, enhancing structural stiffness.
Equivalent Stress
Equivalent stress values highlight potential failure zones. The plain bracket
shows higher stress at the 90° bend due to the fixed backing and downward load,
whereas the ribbed version shifts stress to the rib arms, reducing peak values.
Comparison of Results
-
Total deformation: 0.02602 mm (ribbed) vs. 0.14384 mm (plain) — an 81.9% reduction.
-
Equivalent stress: 66.99 MPa (ribbed) vs. 137.52 MPa (plain) — a 51.3% reduction.
Aerodynamics of an SUV Design (CFD Simulation)
Introduction
In this study, I performed an aerodynamic analysis and redesign of a standard SUV profile using ANSYS Fluent.
Beginning with computation of drag force and coefficient (Cd) at 120 km/hr, I conducted mesh-independence
checks to ensure accuracy. The original, boxy geometry was streamlined—smoothing sharp angles, slanting the windshield,
and rounding edges—to target a ≥30% reduction in drag. The optimized model was then re-simulated and benchmarked
against the baseline, and a velocity vs Cd plot was generated to evaluate performance across operating speeds.
2.0 Analysis of Generic SUV
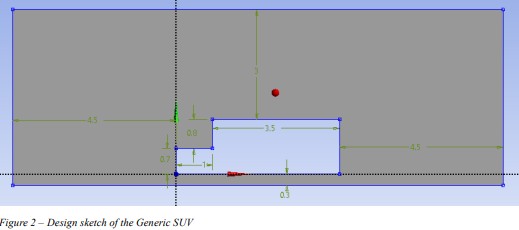
The baseline geometry was modeled in 2D, accurately dimensioned, and enclosed in a bounding box to capture inflow
and outflow behaviors. A steady RANS simulation at 120 km/hr used a realizable k-ε turbulence model with typical
vehicle boundary conditions. Once initialized, the simulation provided pressure and velocity fields for analysis.
2.1 Dimensional 2D Drawing
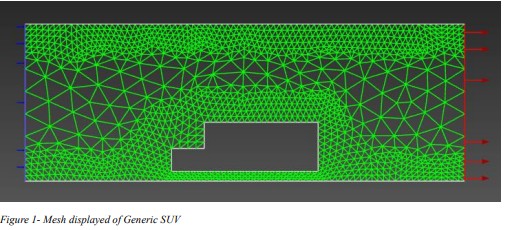
2.2 Mesh of Generic SUV
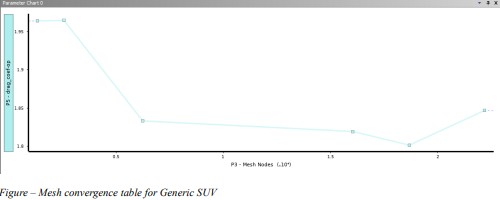
2.3 Mesh Convergence Study
Simulations with increasing cell counts showed drag-coefficient variations under 1% beyond ~250,000 cells,
confirming mesh-independence.
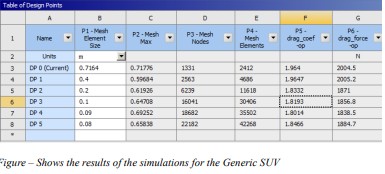
2.4 Results of Generic SUV
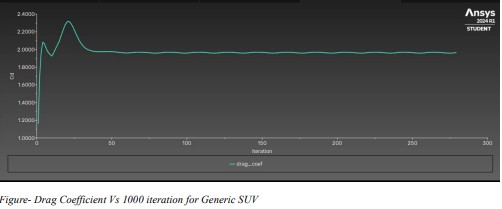
The baseline model exhibited a drag coefficient of Cd ≈ 2.00 at 120 km/hr, with notable flow separation
at the roof-rear junction. These characteristics underscore the need for geometric optimization.
3.0 Analysis of Redesigned SUV
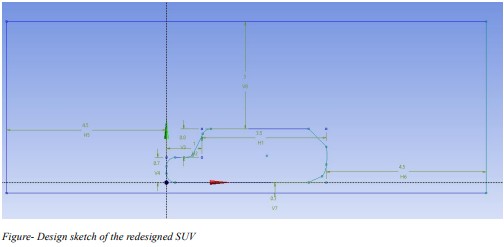
To reduce drag, all 90° angles were smoothed, the windshield sloped back, the nose rounded, and the roof tapered.
These changes aim to minimize separation zones and pressure drag for enhanced aerodynamic efficiency.
3.1 Dimensional 2D Drawing of Redesigned SUV
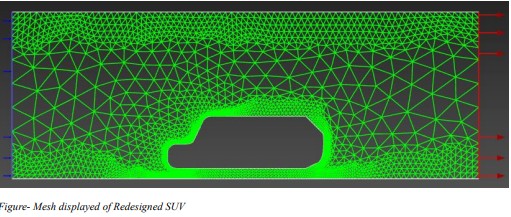
3.2 Mesh of Redesigned SUV
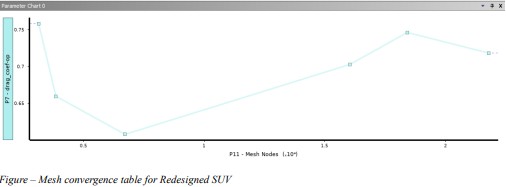
3.3 Mesh Convergence Study
A matching convergence study confirmed stability of Cd readings beyond ~250,000 cells,
maintaining consistency with the baseline.
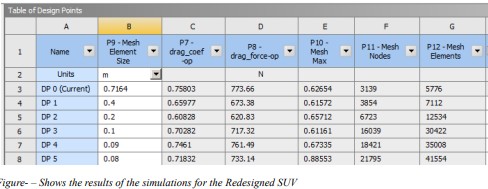
3.4 Results of Redesigned SUV
The optimized geometry achieved a drag coefficient of Cd ≈ 0.76—a 62% reduction—along with
smoother flow attachment and smaller wake regions.
4.0 Comparative Analysis
The comparative analysis of the generic and redesigned SUVs highlights notable improvements
in aerodynamic efficiency. The drag coefficient of the redesigned SUV stabilized at
approximately 0.7594, while the generic SUV’s drag coefficient stabilized at around 2. This
results in a reduction of 62%, demonstrating that the redesigned SUV is more aerodynamically
efficient and performs better than the generic model.
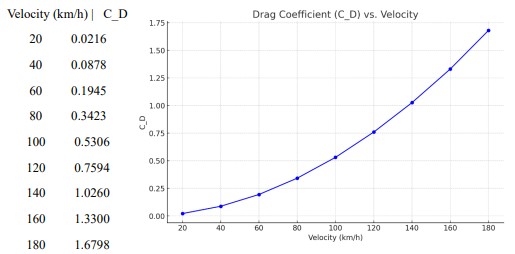
4.1 Velocity vs. Drag Coefficient
The plot illustrates the relationship between velocity and the drag coefficient for the redesigned
SUV. As the velocity increases from 20 km/h to 180 km/h, the drag coefficient shows a
progressive increase. At lower speeds, specifically from 20 km/h to 60 km/h, the drag coefficient
remains relatively low, suggesting that the redesigned SUV is more aerodynamically efficient at
these speeds, experiencing minimal drag. This efficiency at lower speeds indicates that the
design modifications, such as a smoother front profile and optimized roofline, are particularly
effective in reducing aerodynamic resistance, thereby enhancing fuel efficiency and overall
performance in everyday driving conditions. The gradual increase in drag coefficient with higher
velocities is expected, but the significant reduction in drag at lower speeds highlights the success
of the redesign in achieving the primary objective of improved aerodynamic performance.
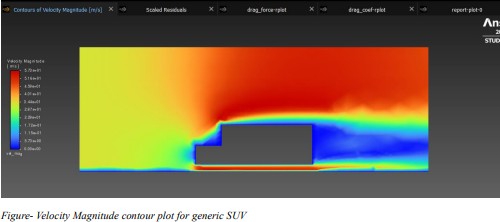
4.2 Contour & Magnitude Plots
Velocity-magnitude contours showcase the reduced wake behind the redesigned SUV,
highlighting improved flow characteristics.